Data Visualization
Size Matters: Investigating Size Ranges in Popular Lingerie Brands
#FashionWeek on Twitter: An Interactive Analysis
Introduction
High Fashion Twitter is a corner of the platform for people who love high fashion or work in the industry, though anyone can join the conversation. The community gained its biggest recognition in 2020, when Vogue covered @HFMetGala, an inclusive online Met Gala created by a group of accounts so everyone could participate. This project analyzes how that community discussed the big four fashion weeks (New York, London, Milan, and Paris) and seven luxury houses (Louis Vuitton, Chanel, Dior, Balenciaga, Prada, Valentino, and Yves Saint Laurent) between 2020 and 2023.
Research questions
How often was fashion week discussed each year, and who drove the conversation? Are verified or unverified users more active and influential? Which brands were mentioned, and how did their audiences change over time? Where did fashion week conversations come from, and how did users feel about each fashion week?
Data and methods
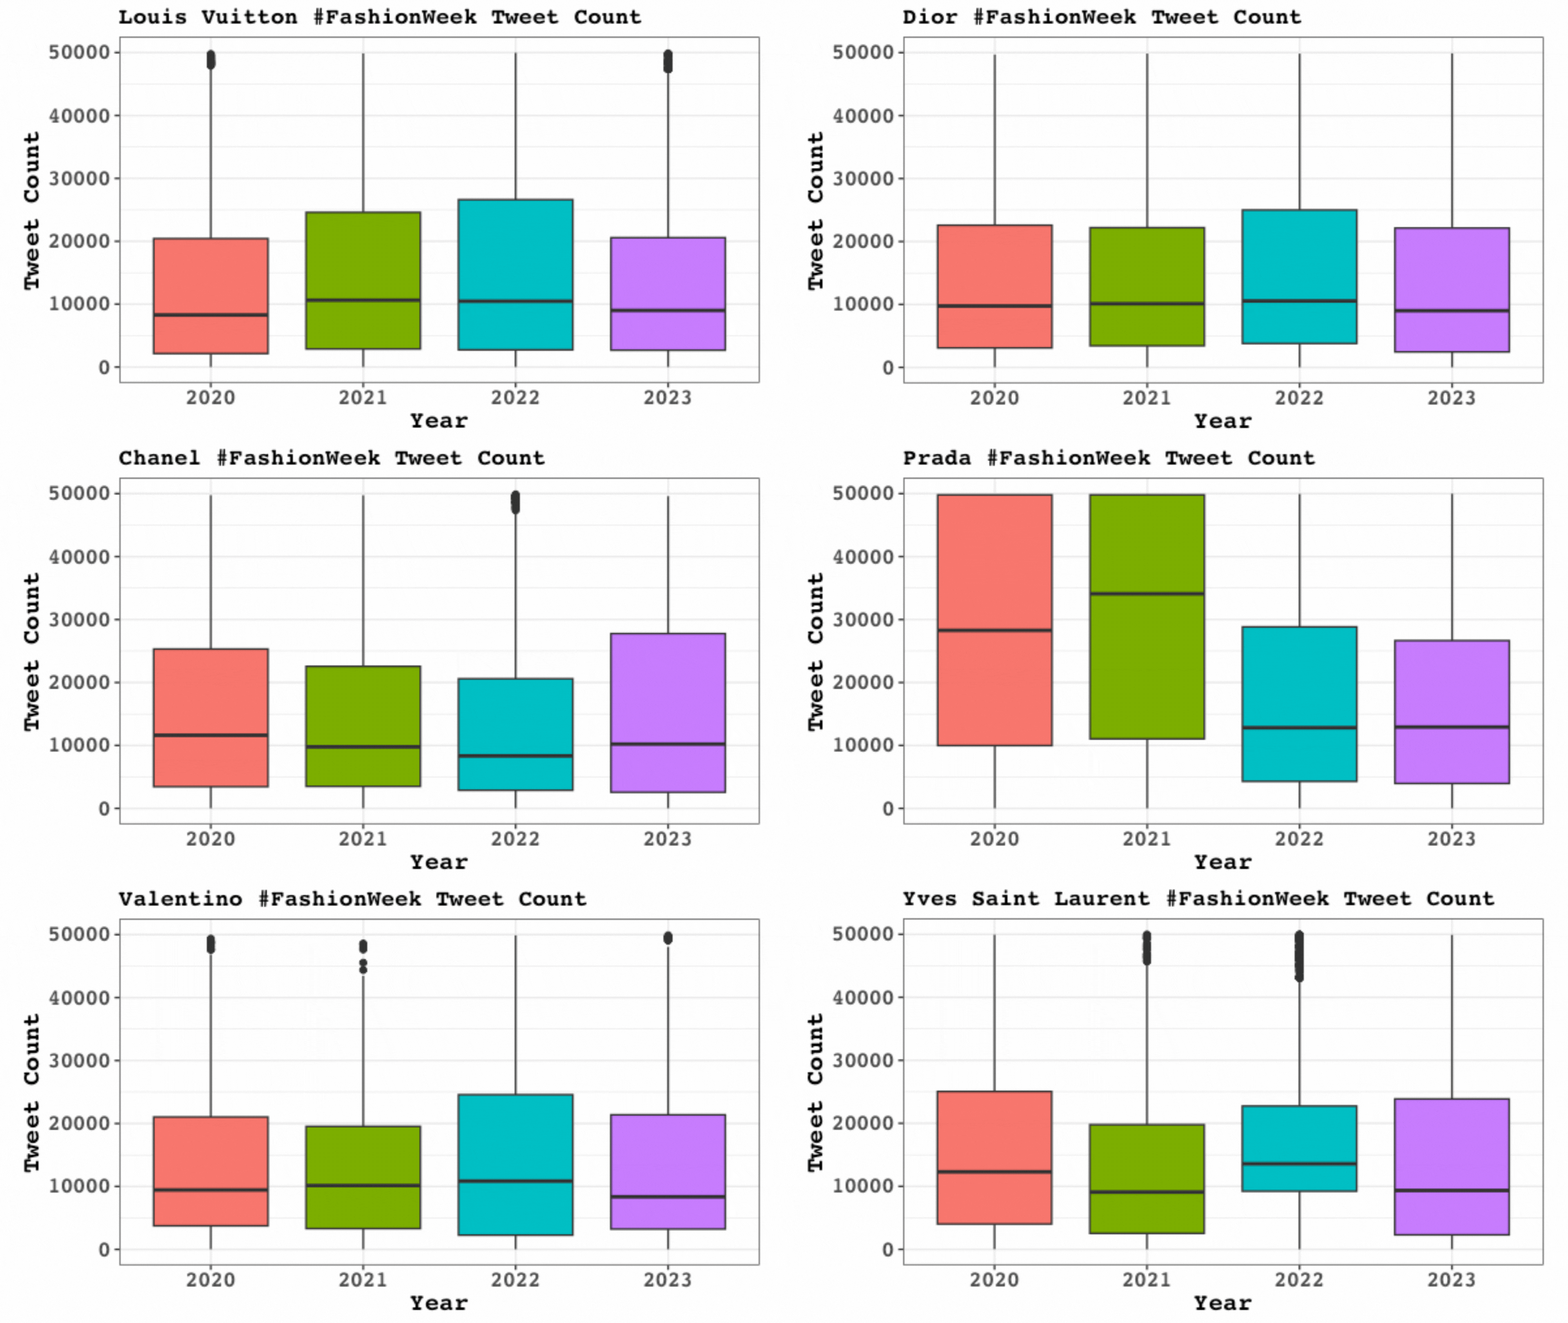
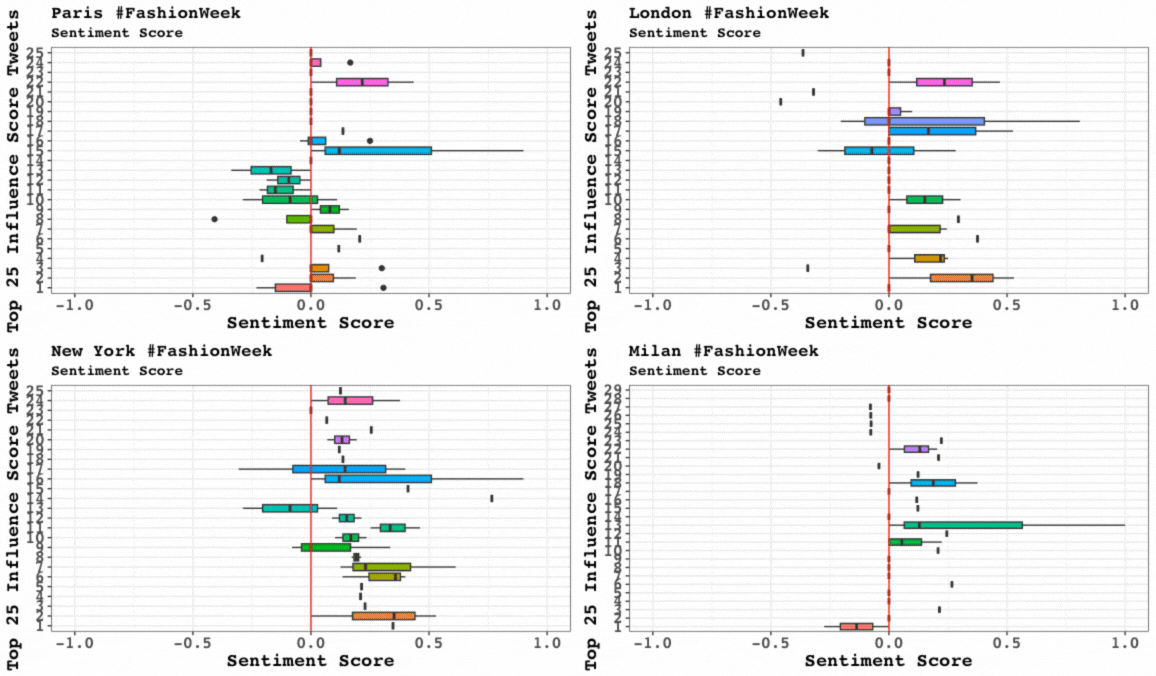
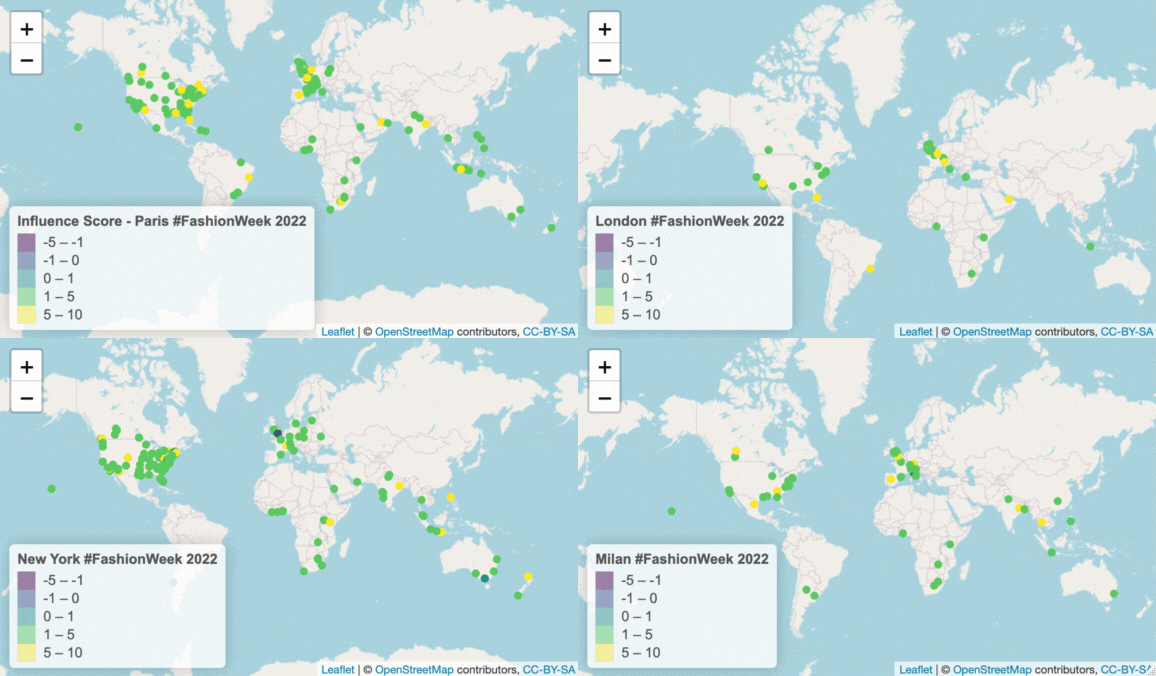
The dataset, scraped by Gyula Zsombok, contains every tweet mentioning fashion week from 2020 to 2023. To measure who was shaping the conversation, I created an influence score for each posting account: followers + 1 divided by following + 1, multiplied by the account's total tweets + 1, then log-scaled (base 10). This estimates an account's reach and activity. The tweet count box plots compare how active the accounts discussing each brand were, based on their lifetime number of tweets. The Leaflet maps show where each fashion week's conversation came from and how influential those voices were, and sentiment analysis with the sentimentr package scores the tone of the 25 most influential tweets for each city.
Key findings
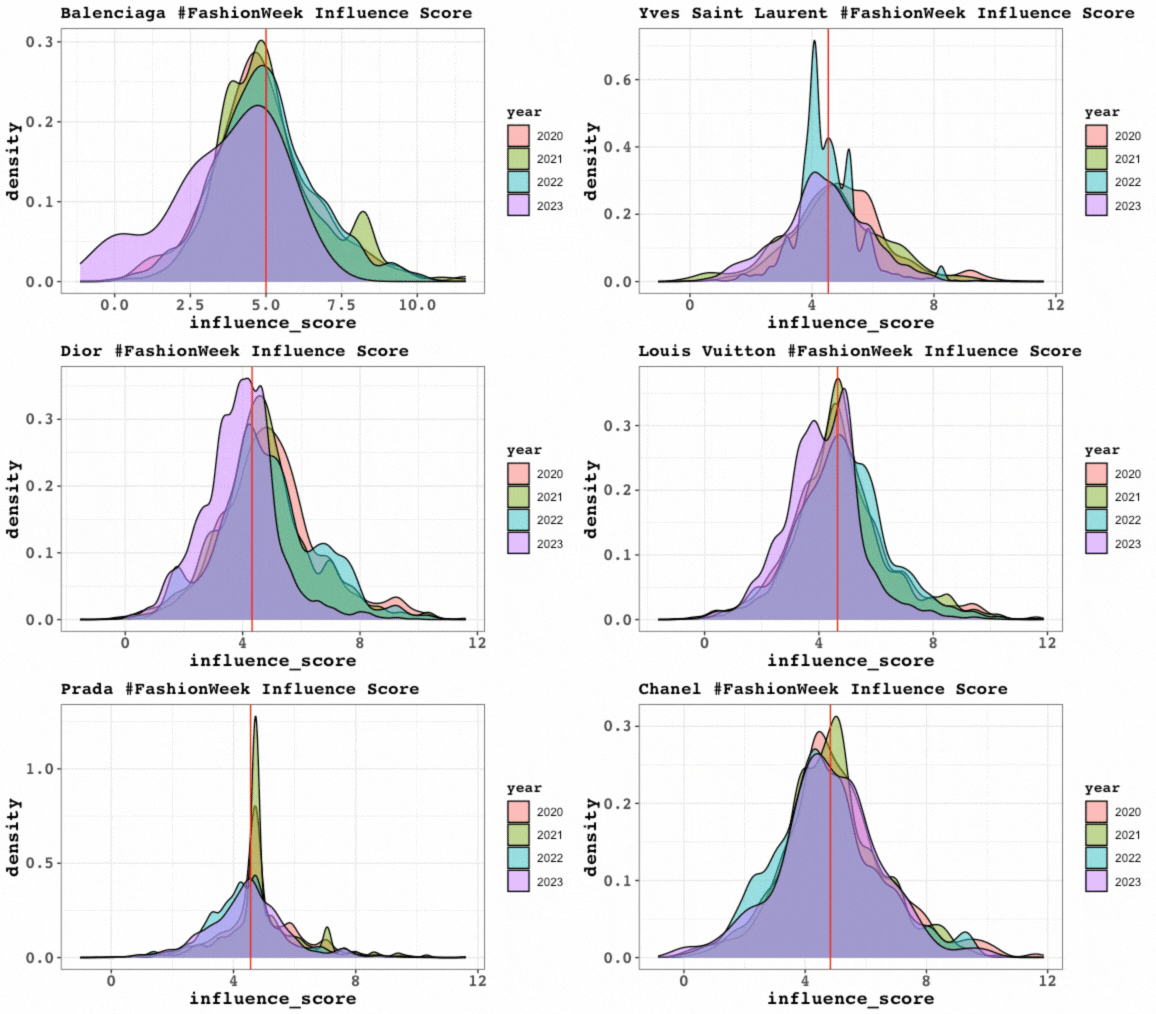
The conversation around luxury houses shifted in revealing ways. Accounts discussing Louis Vuitton became more active from 2020 through 2022 before easing in 2023, suggesting the brand drew an increasingly engaged audience during those years. Balenciaga's audience told a different story: influence scores clustered tightly around the average from 2020 to 2022, then spread toward lower scores in 2023, as more smaller, less established accounts joined the conversation. That shift coincided with the brand's widely criticized late-2022 ad campaign controversy. Mapping Paris Fashion Week in 2022 showed how a single city's event becomes a global conversation, with posts from North America, Europe, the Middle East, Africa, and Asia-Pacific. And the most influential voices discussing Paris were mostly neutral in tone, suggesting they tended to inform and discuss rather than simply praise.
Challenges and what I refined
I originally wanted to track whether celebrities were mentioned in fashion week tweets, but reliably identifying celebrity names in text proved too complex within the project timeline. Building the Shiny app also pushed me to prioritize: with so much I wanted to cover, I had to be strategic to tell a clear story, and the longer my code grew, the harder it became to connect my buttons to my graphics.
Revisiting the project in 2026, I solved that last challenge by restructuring the app so every brand, year, and city selection runs through a single streamlined function. I also tightened the text matching so abbreviations like "LV" and "NY" no longer pick up unrelated words, and adjusted the charts to zoom without dropping data, making the analysis both more accurate and easier to maintain.